

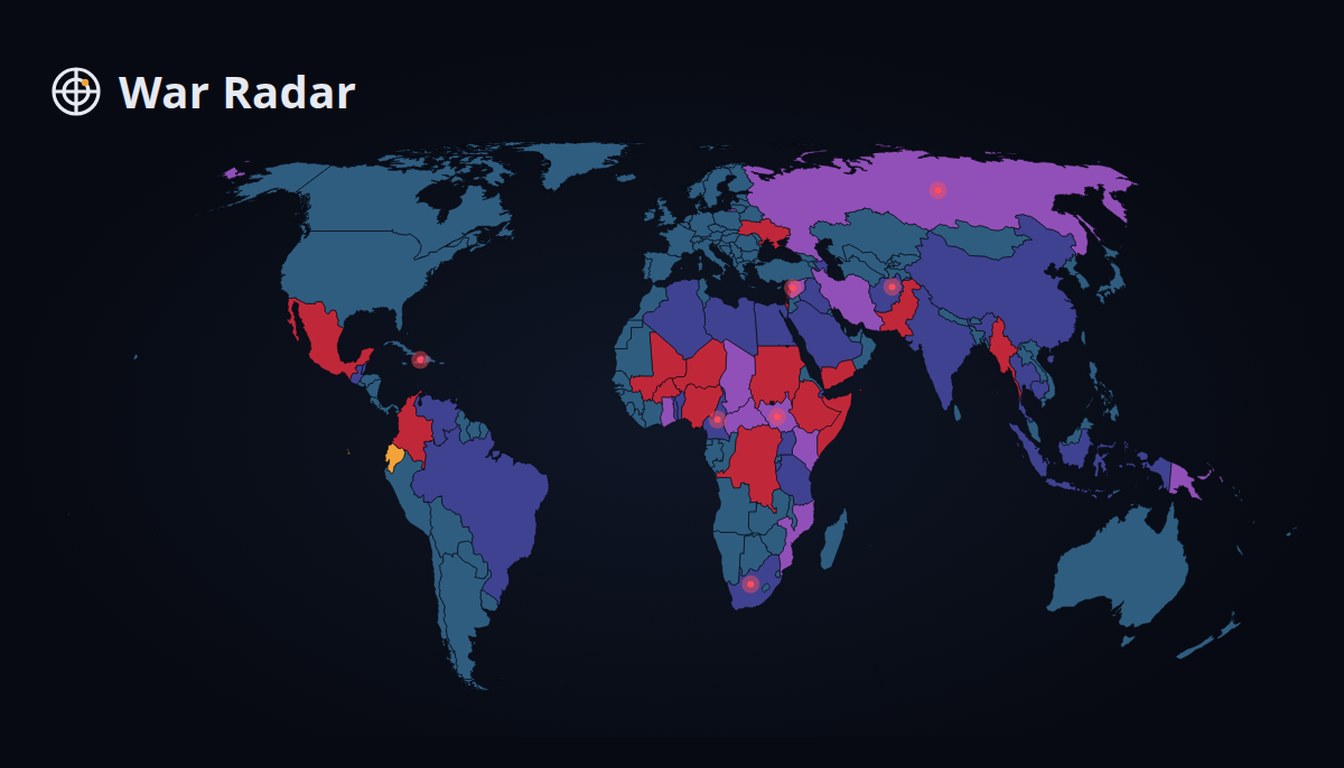
We have launched our own project — War Radar, a world map that shows every day where wars are going on right now and which countries face a rising risk of a new armed crisis or coup within the next 90 days. Everything is calculated automatically from open public information, with no manual edits.
What the site shows
- Every country, every day — “happening now” shown separately (major war, armed violence, coup, major disaster, epidemic, internet shutdown), plus a four-level estimate of the risk of a new crisis: low, elevated, high, very high.
- 16 countries — as of 3 October 2026, a major armed conflict is ongoing in this many countries (at least 1,000 deaths in the past year and 25 in the past month).
- Every 2 hours — a check for reported evacuations of embassy staff and new official travel warnings from several governments. A new evacuation appears in the “Latest events” feed and on the country page.
- Early mark for a sharp escalation in fighting — when reports of fighting in a country suddenly become much more frequent, an AI reads the article headlines and decides whether this looks like a new outbreak.
- 5 languages — English, Ukrainian, Polish, German, Spanish; weekly summaries back to 2018.
Honest about accuracy
War Radar is not a forecast and not travel advice — it is a rough automated estimate. The formula was fitted on 2015–2022 and checked on 2023–2026, years it had not seen. In that check, weeks at the “low” level were followed by a new crisis in about 1 case in 110, and weeks at “very high” in 1 in 4. So even at the top level, most weeks are followed by nothing, and the site says so plainly. On a separate “Checking the estimates” page, every weekly estimate made after launch is compared with what happened over the next 90 days — misses included.
How it works
A Python pipeline runs fully autonomously on our server on a schedule: it collects data, runs the formula, stores daily snapshots in SQLite and generates a static site served by nginx. Reports of evacuations and escalations are analysed by AI models. If any step fails, the server sends us a Telegram alert on its own. Every page has its own title and description in five languages, JSON-LD markup, hreflang and an llms.txt file for AI search.
Need a similar system for your data?
We build automated dashboards and websites that collect data, calculate metrics and update themselves without human involvement. Get in touch — let’s discuss your task.